Stock Portfolio
My own brokerage accounts, the market around them, and an AI that reads both.

- Role
- Design · Full-stack · Infra
- Team
- Solo
- Year
- 2026
- Stack
- Python · FastAPI · SQLite · pandas · Claude Code CLI · llama.cpp · Vanilla JS · nginx · Cloudflare
Stock Portfolio is the research desk I wanted and couldn’t buy. It follows several of my own brokerage accounts across Korean and US markets, keeps a daily record of holdings, P&L and trades, and puts price structure, financial statements and news next to every position. On top of that sit three kinds of LLM work: a per-symbol verdict, a daily news briefing by theme, and a chat assistant that can look things up in the account on its own. It is a personal tool, not a product — every account in it is mine, each one is PIN-locked, and the code is shaped around one person’s mornings.
Every amount in the screenshots below is blurred, and the account names are replaced. Percentages and the shape of the charts are left as they are.
Problem
My money sits across several brokers and two markets, and none of their apps agree on what a “position” is. Getting a straight answer to “how is this account doing, and should I care about this one holding today?” meant four apps, a spreadsheet, and twenty browser tabs of news I would skim and forget.
The research half was worse. Chart reads, fundamentals and news live in different places, so a judgment about a stock was always assembled from whichever of the three I happened to look at last. I wanted the evidence to meet before I decided — and I wanted someone to have read the news when I hadn’t.
Approach
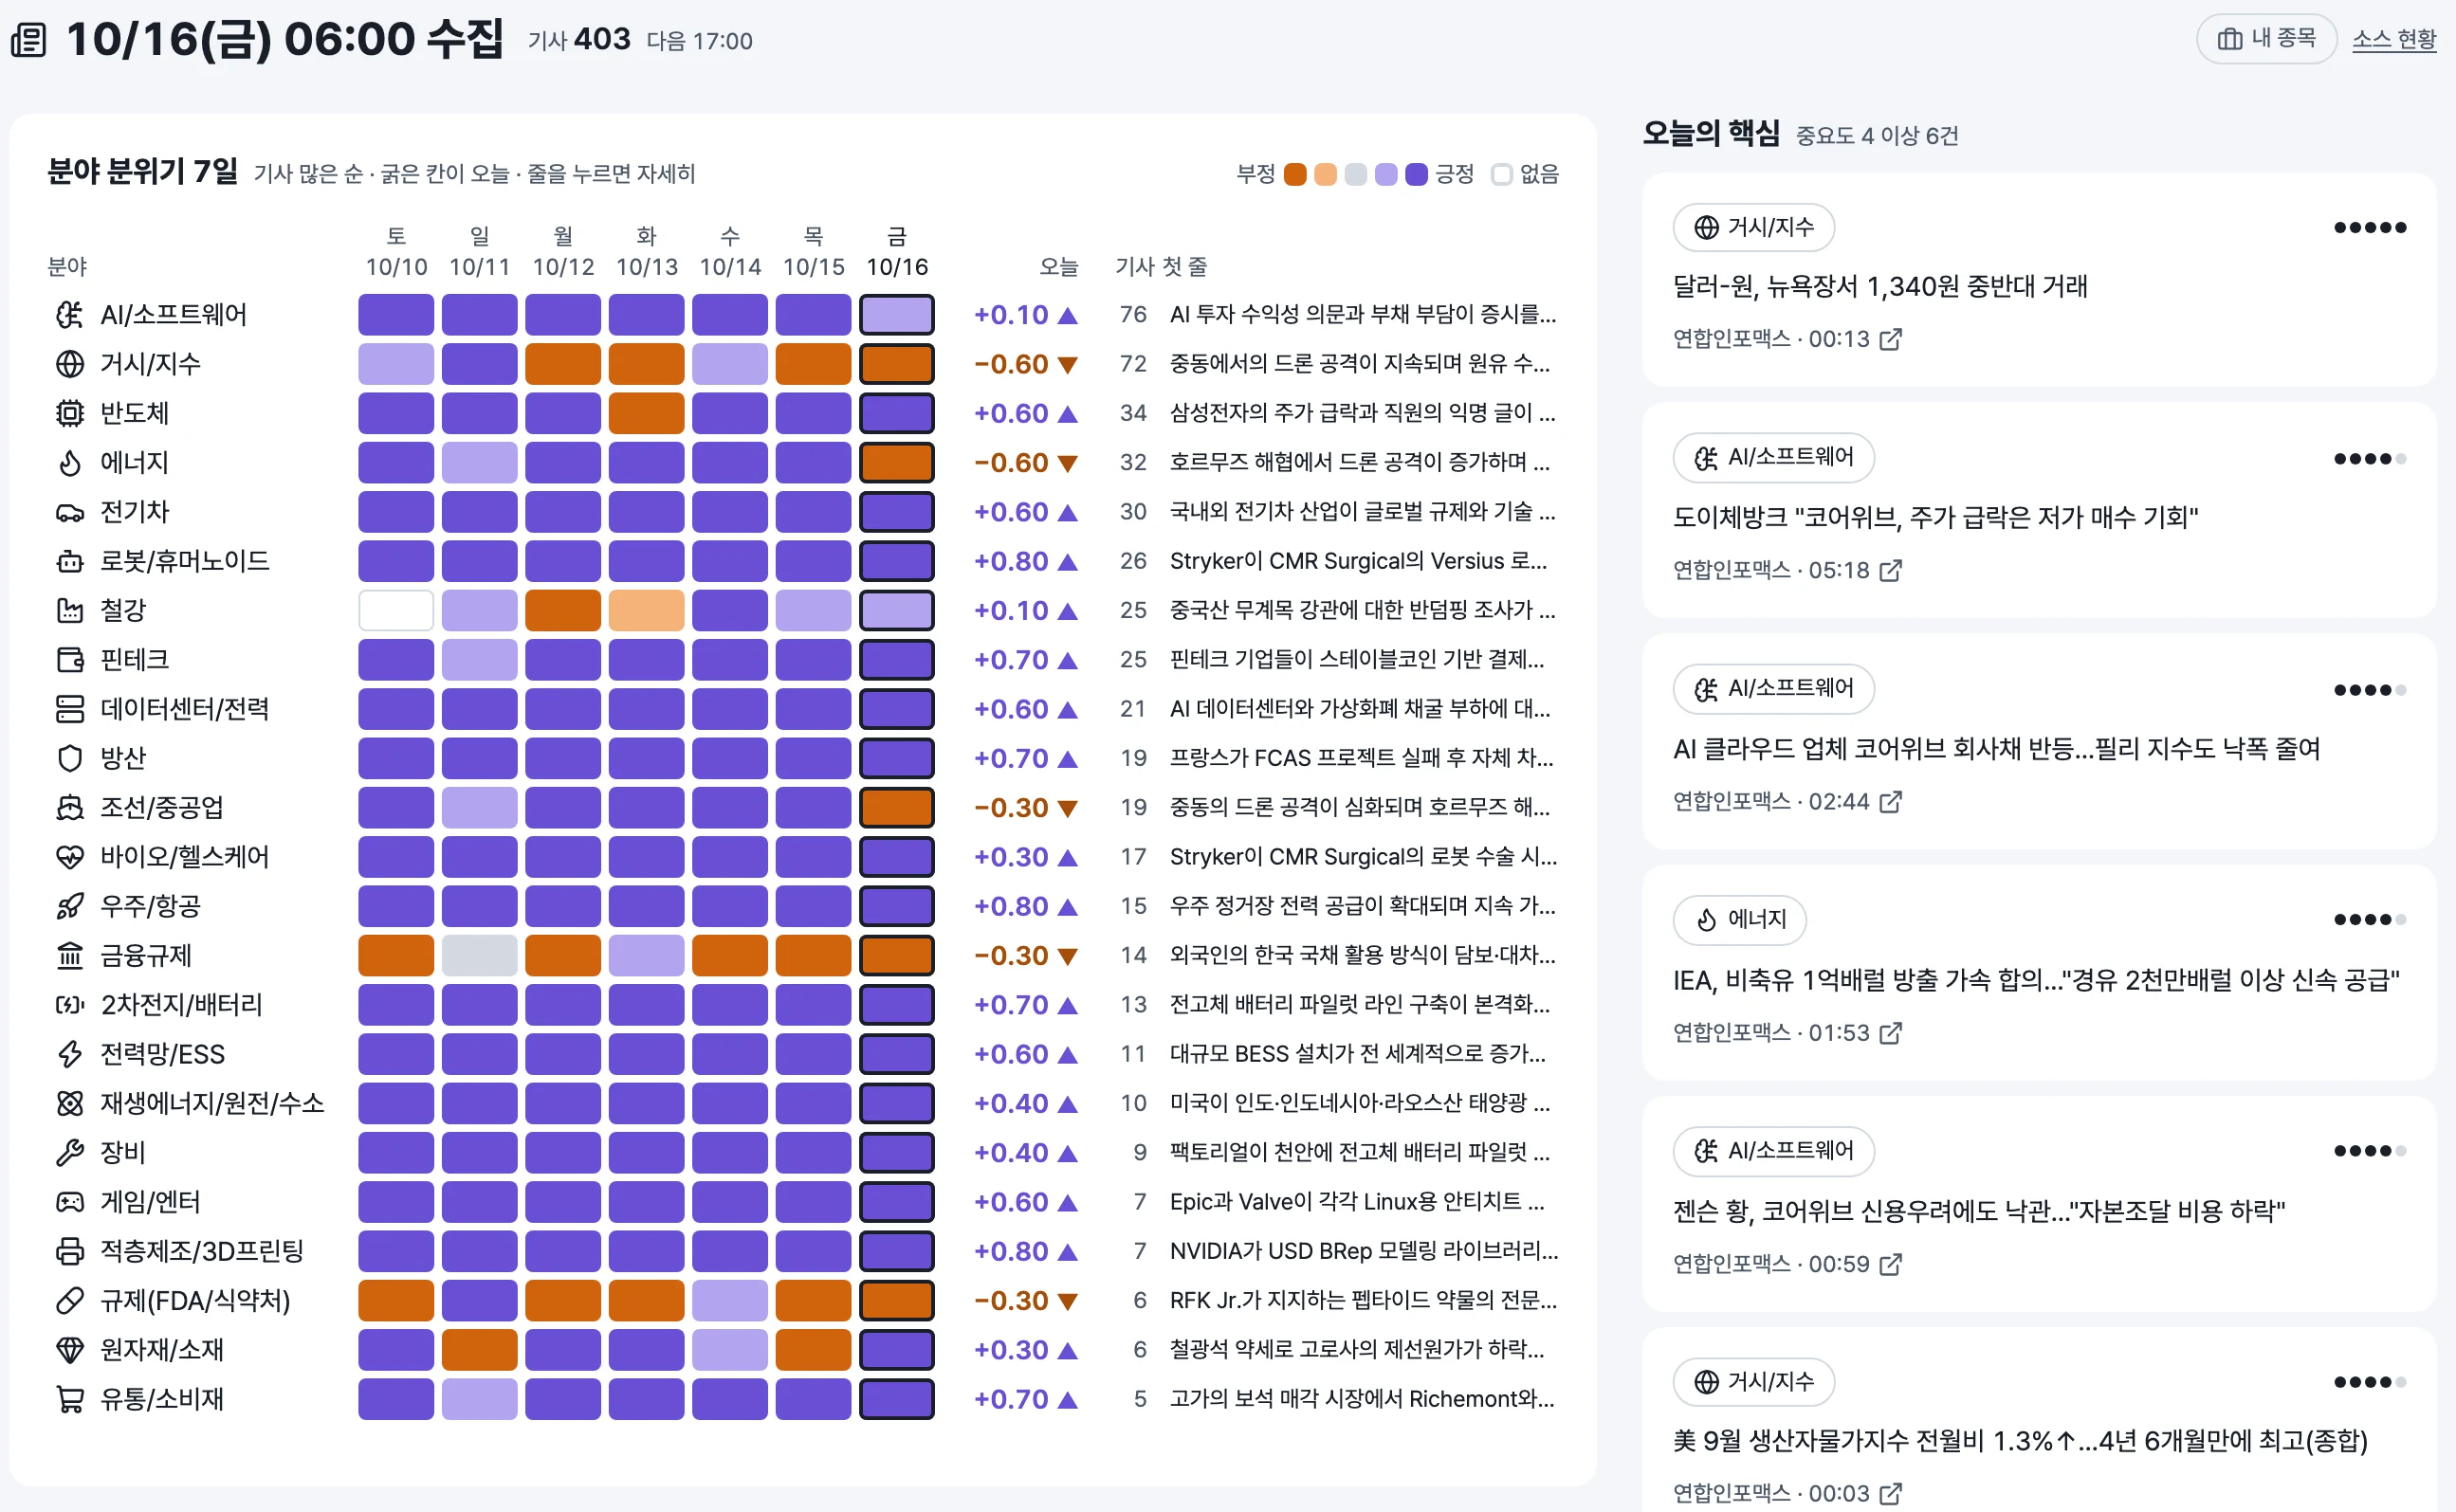
News first, sorted by mood. Twice a day a cron job pulls a curated set of feeds, tags each article to the themes it touches — 23 in all — and has a model write a summary and an importance score for it. The home page compresses that into one grid: a week of sentiment per theme, today’s swing, and the first line of the busiest story. Beside it, only the articles scored important enough to interrupt me.
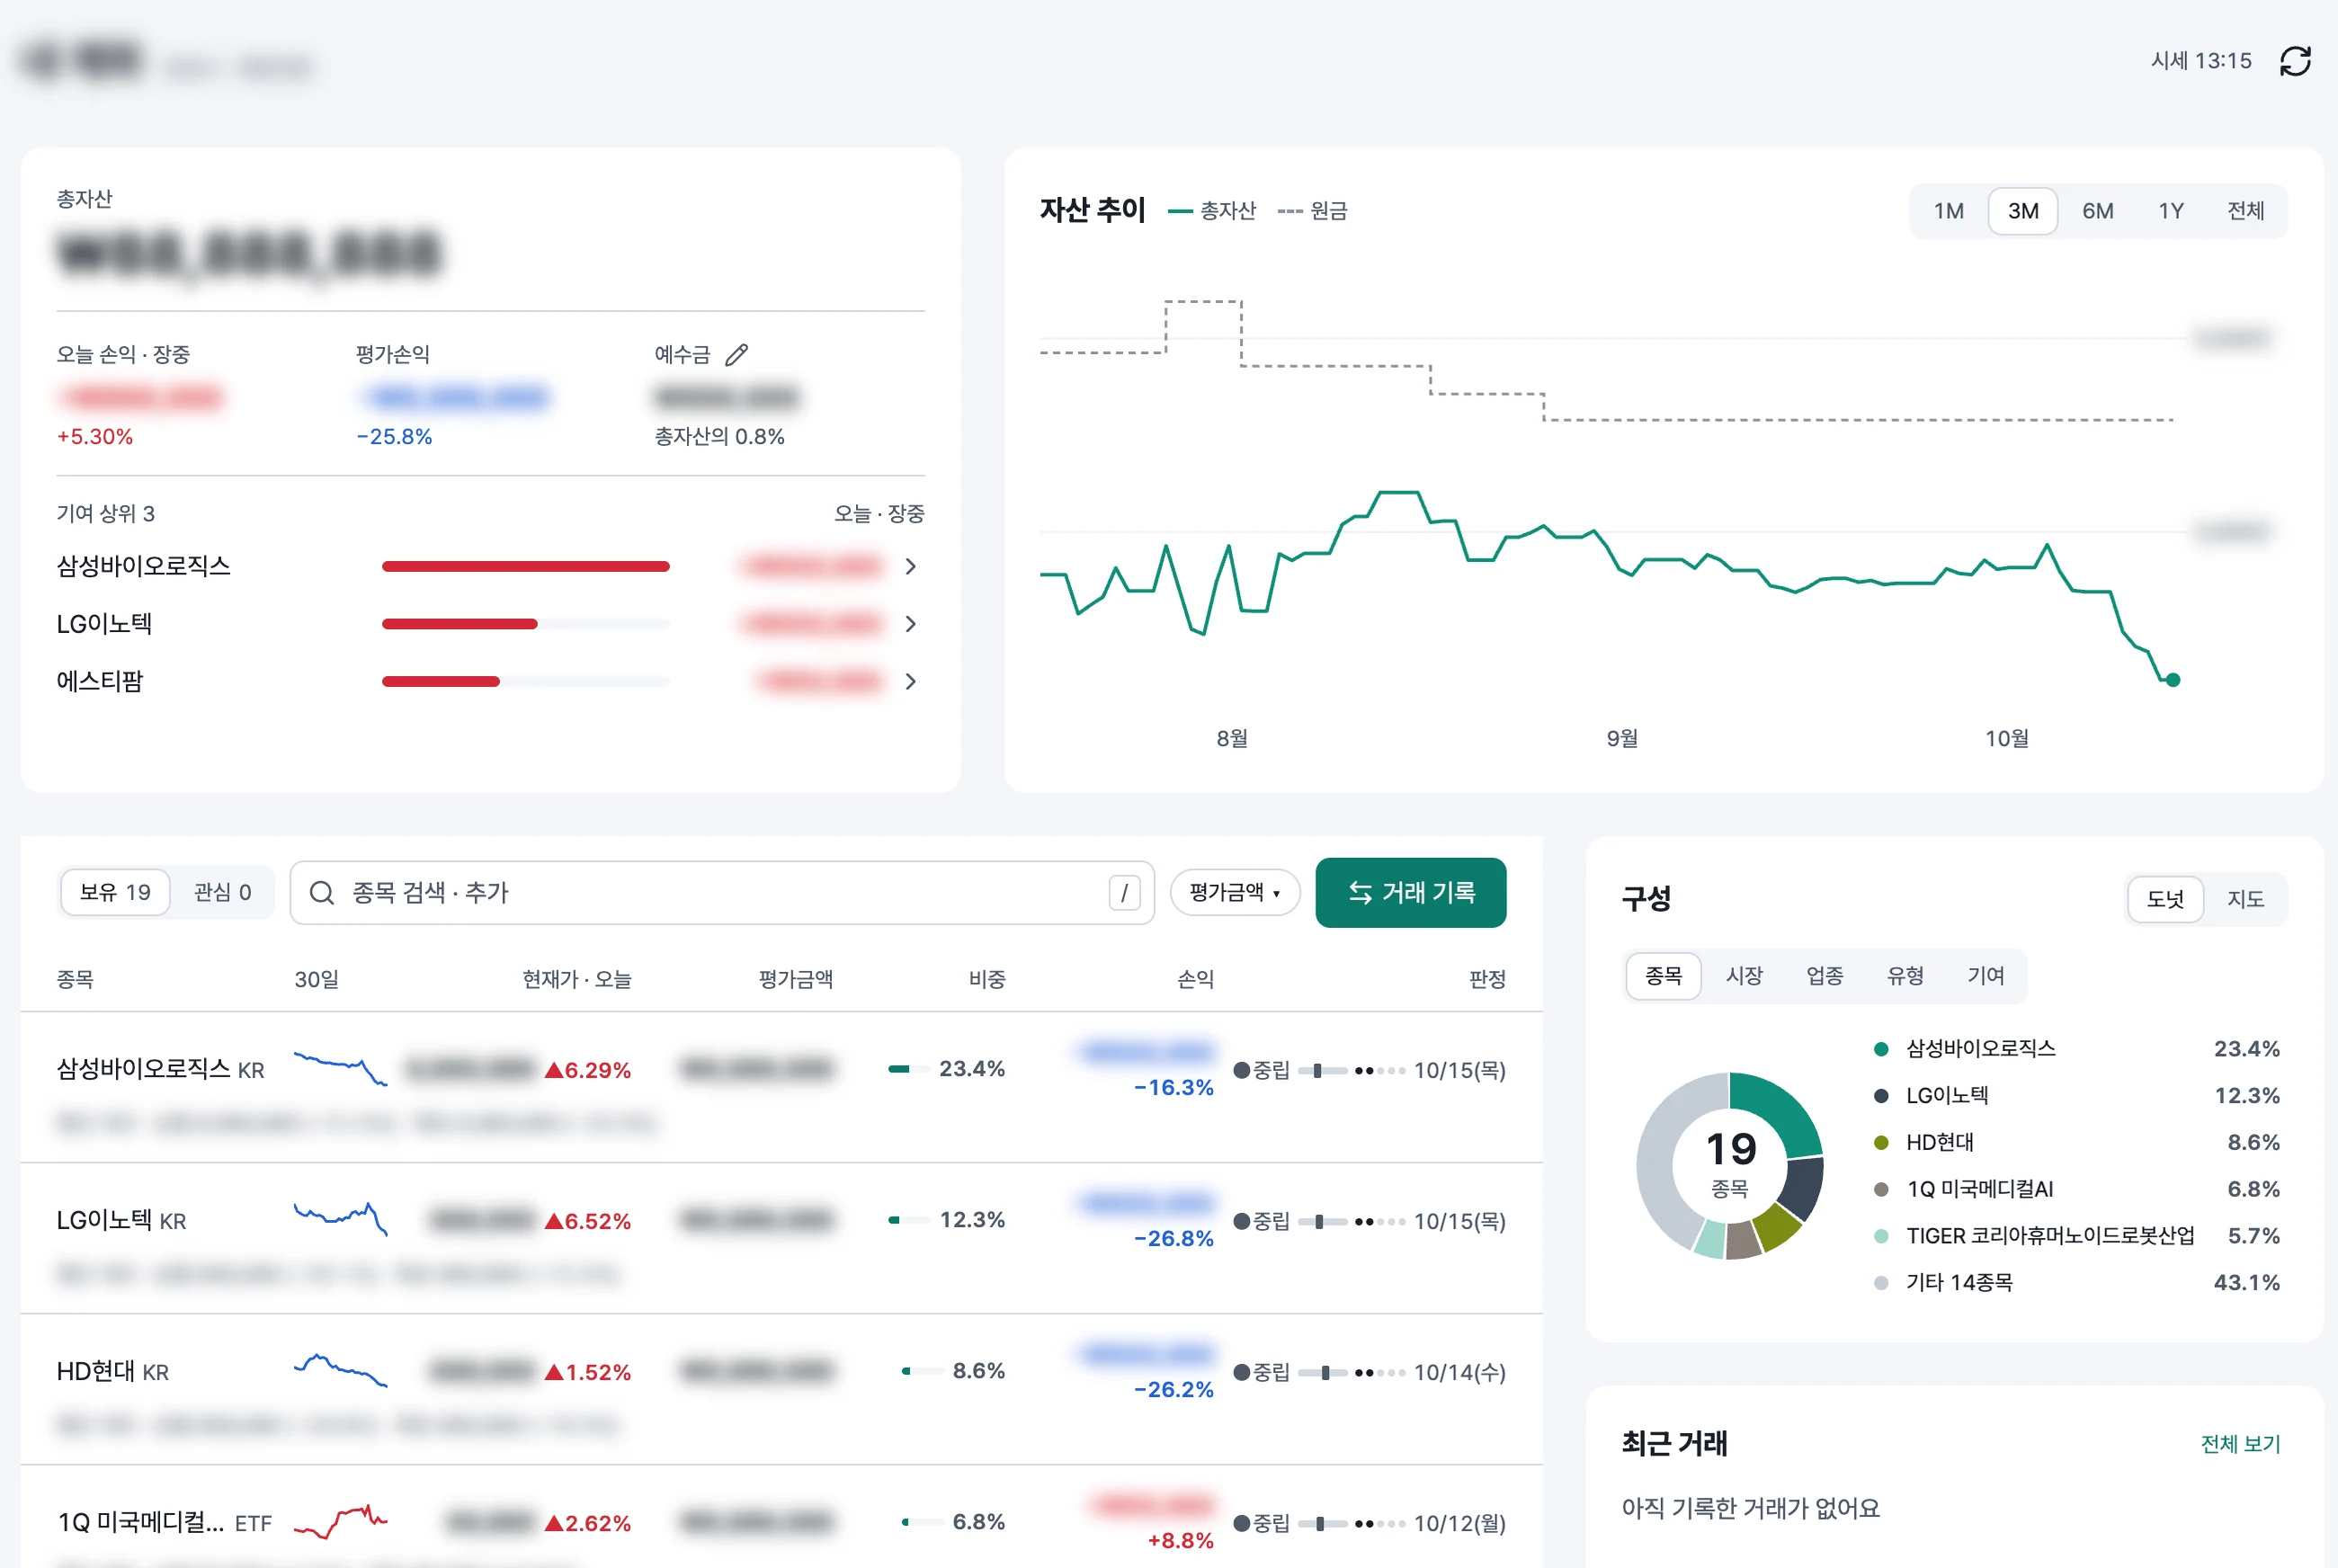
One book per account. Holdings, cash, trade history and daily asset snapshots are kept per account in KRW and USD, priced against live quotes. The account page answers the morning question in one screen — total, today’s P&L, what moved it, how concentrated I am — and every holding row carries the latest AI verdict and when it was made.
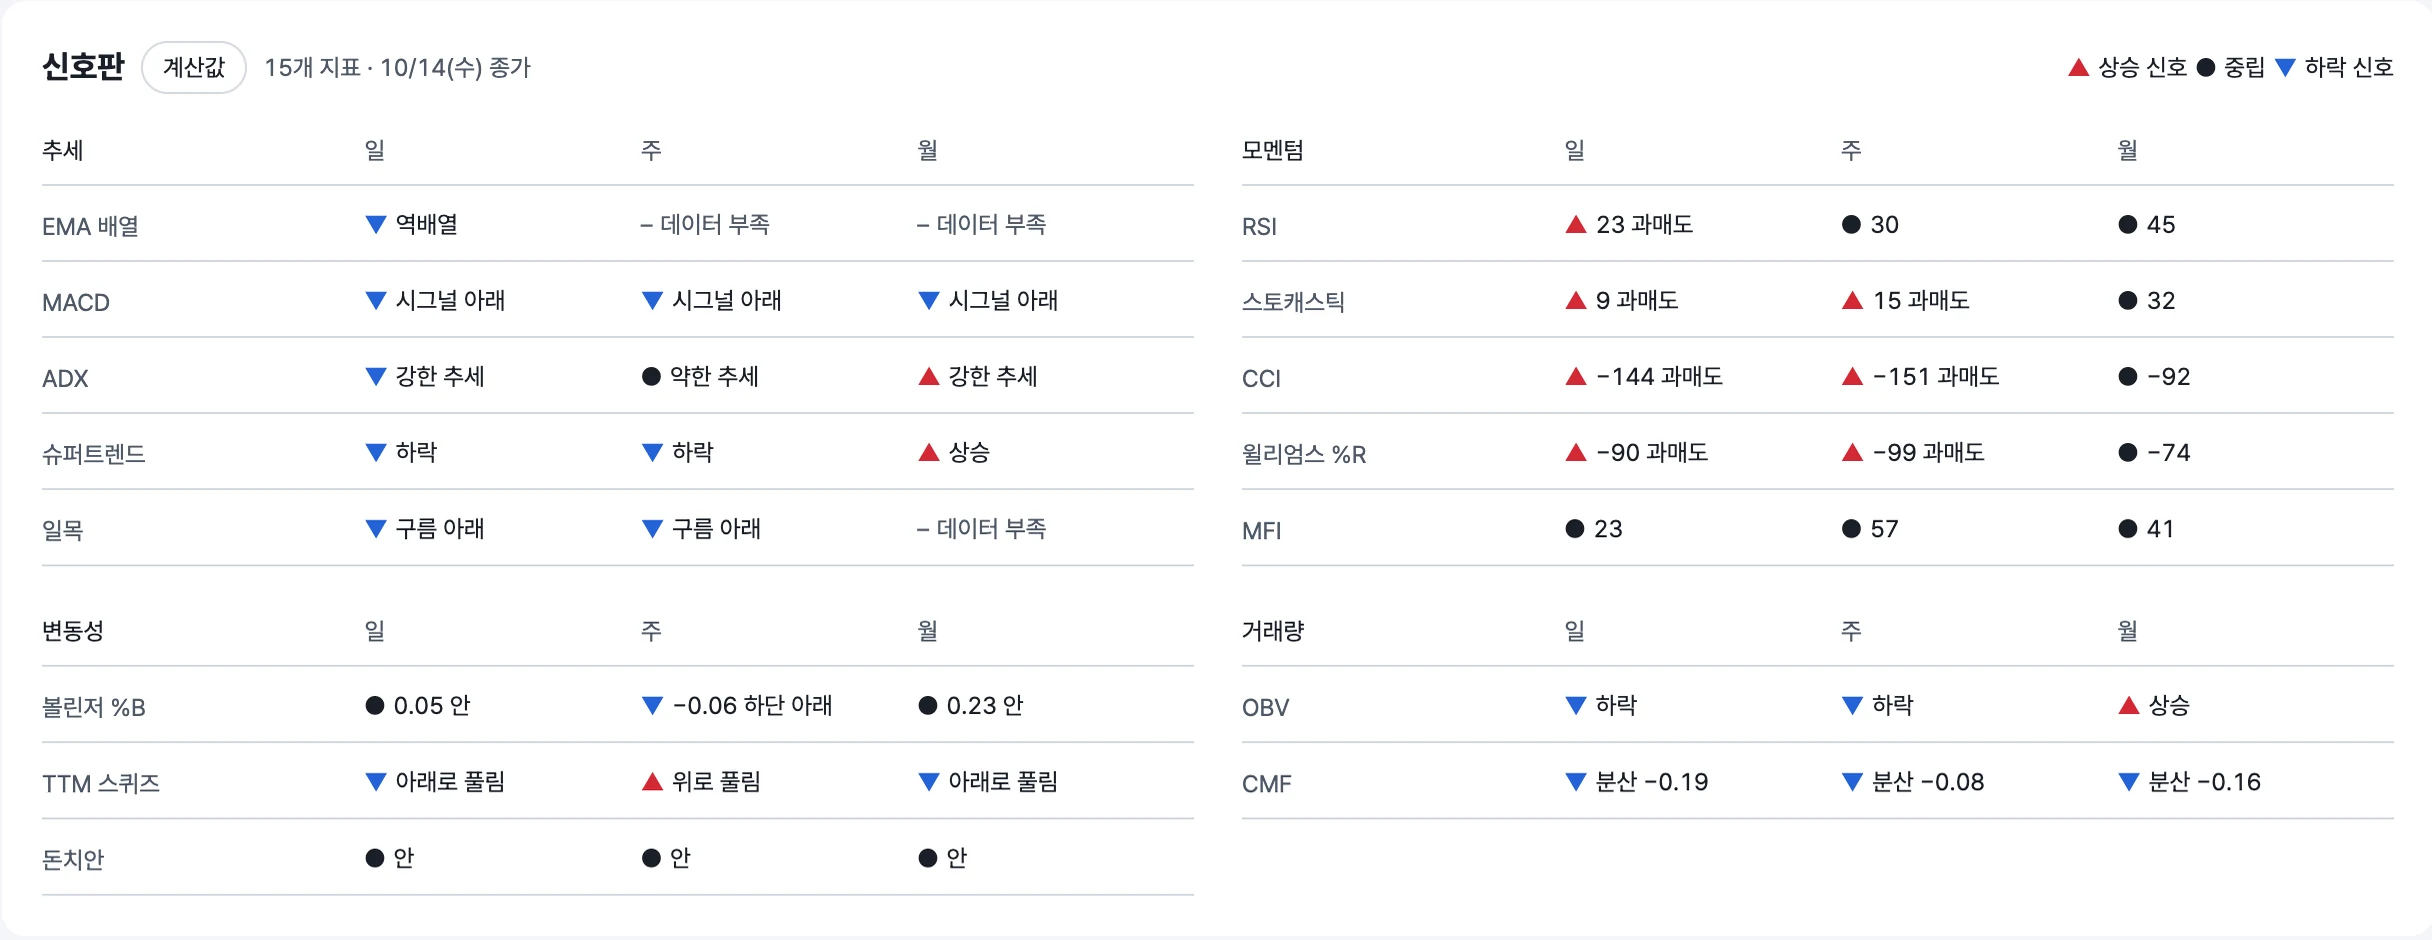
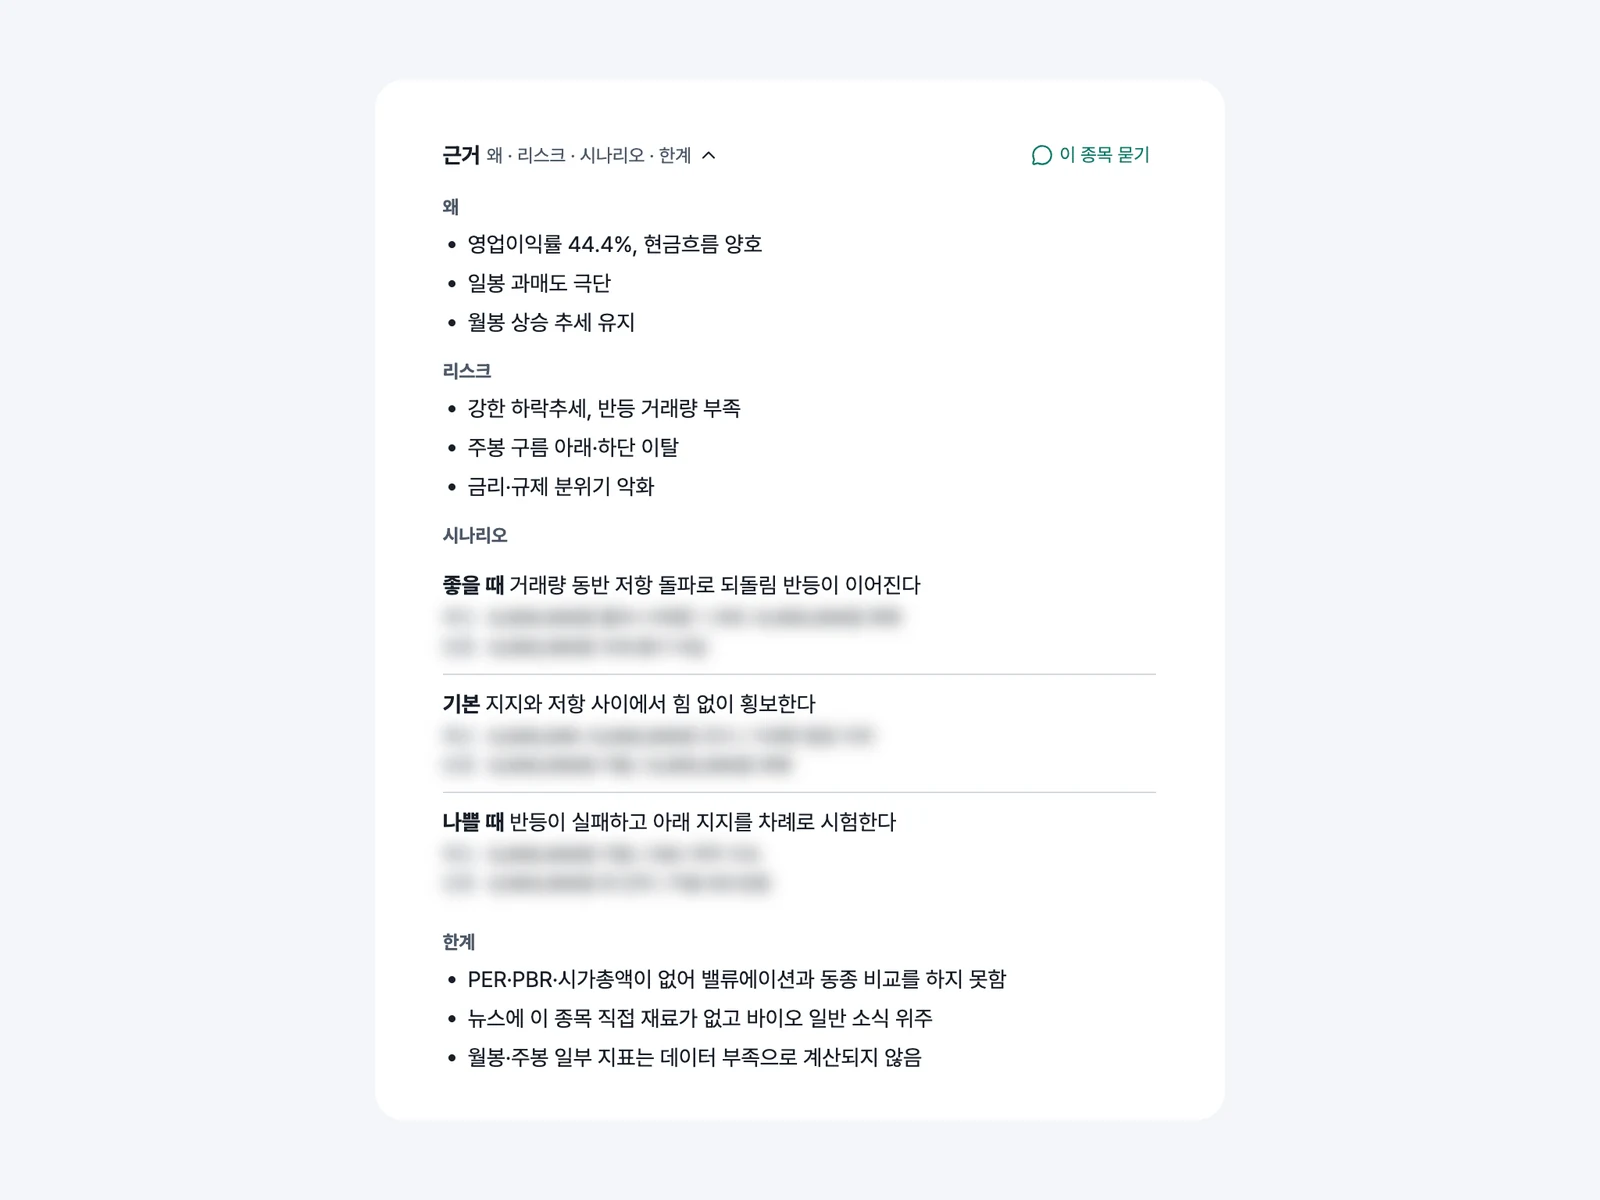
Deterministic first, model second. Everything that can be computed is computed in Python: 15 indicators across trend, momentum, volatility and volume on daily, weekly and monthly bars; swing points, support and resistance, trendlines and divergences; standardized statements with Piotroski F, Altman Z and peer percentiles within the sector. Only then does one model call read chart, fundamentals and news together and return a verdict, a target, an invalidation level and the case against itself. The analysis is deliberately not split into three calls merged afterwards — evidence has to meet before the judgment, not after.
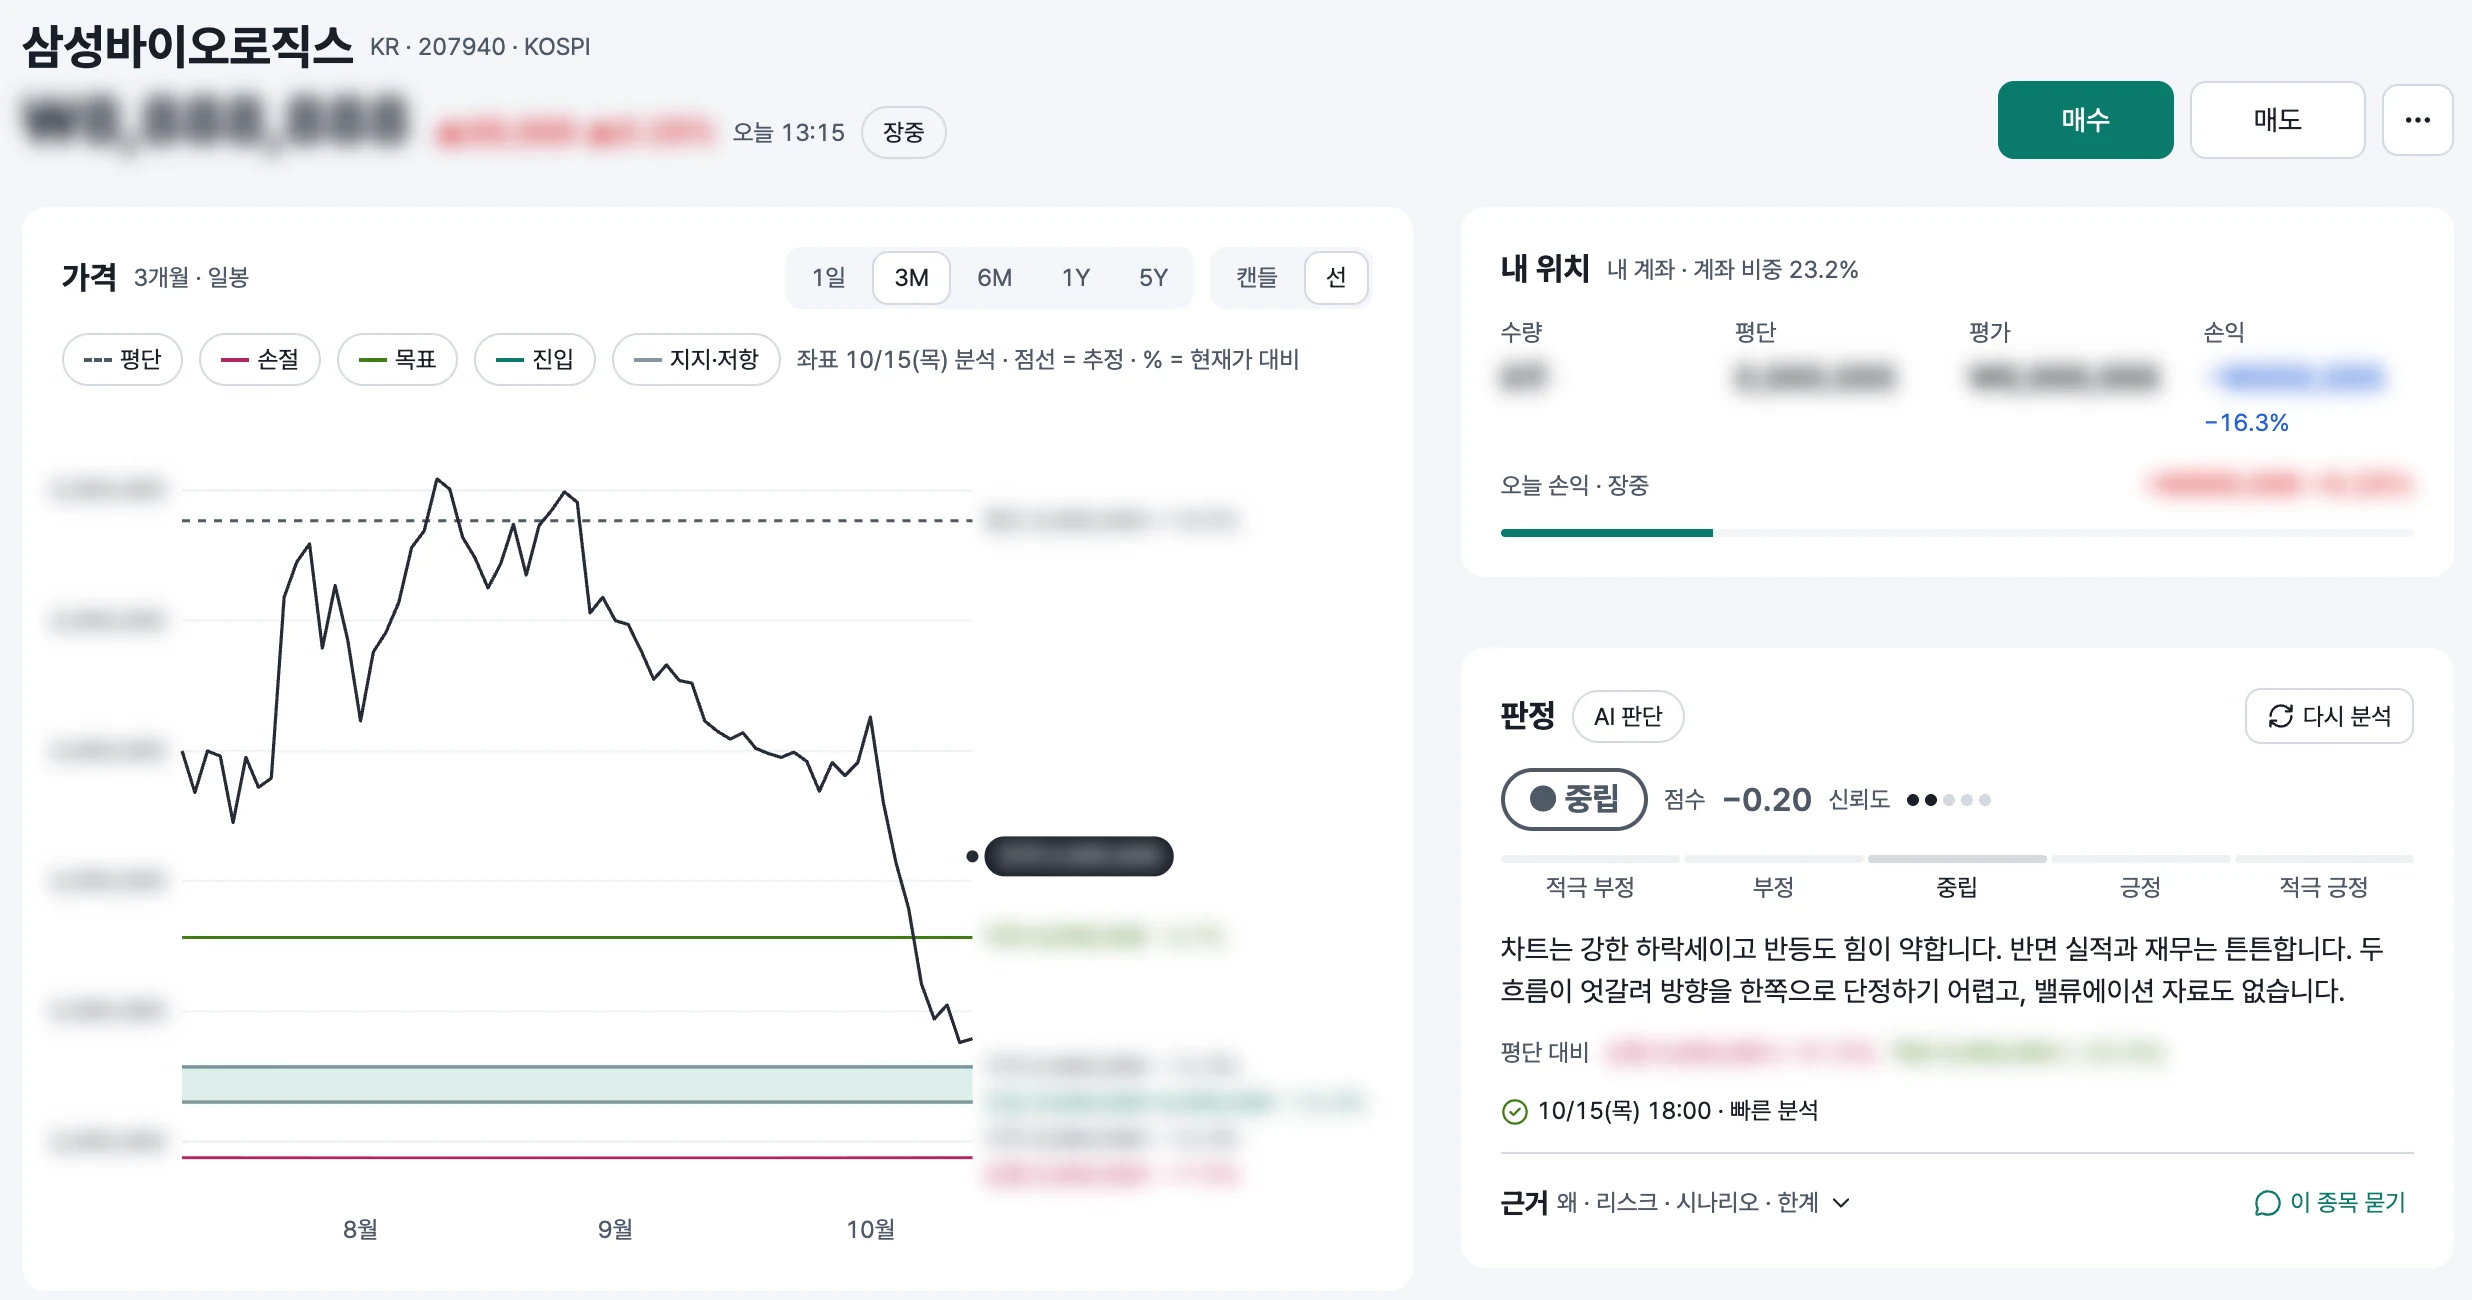
Shallow validation, no invented numbers. Inputs reach the model as {id, reference, data, status} envelopes, so a missing series arrives labelled as missing rather than as zero. On the way back, enums are coerced and numbers clamped, but a level the model didn’t give stays empty. The “한계” (limits) list under every verdict is part of the contract, not decoration.
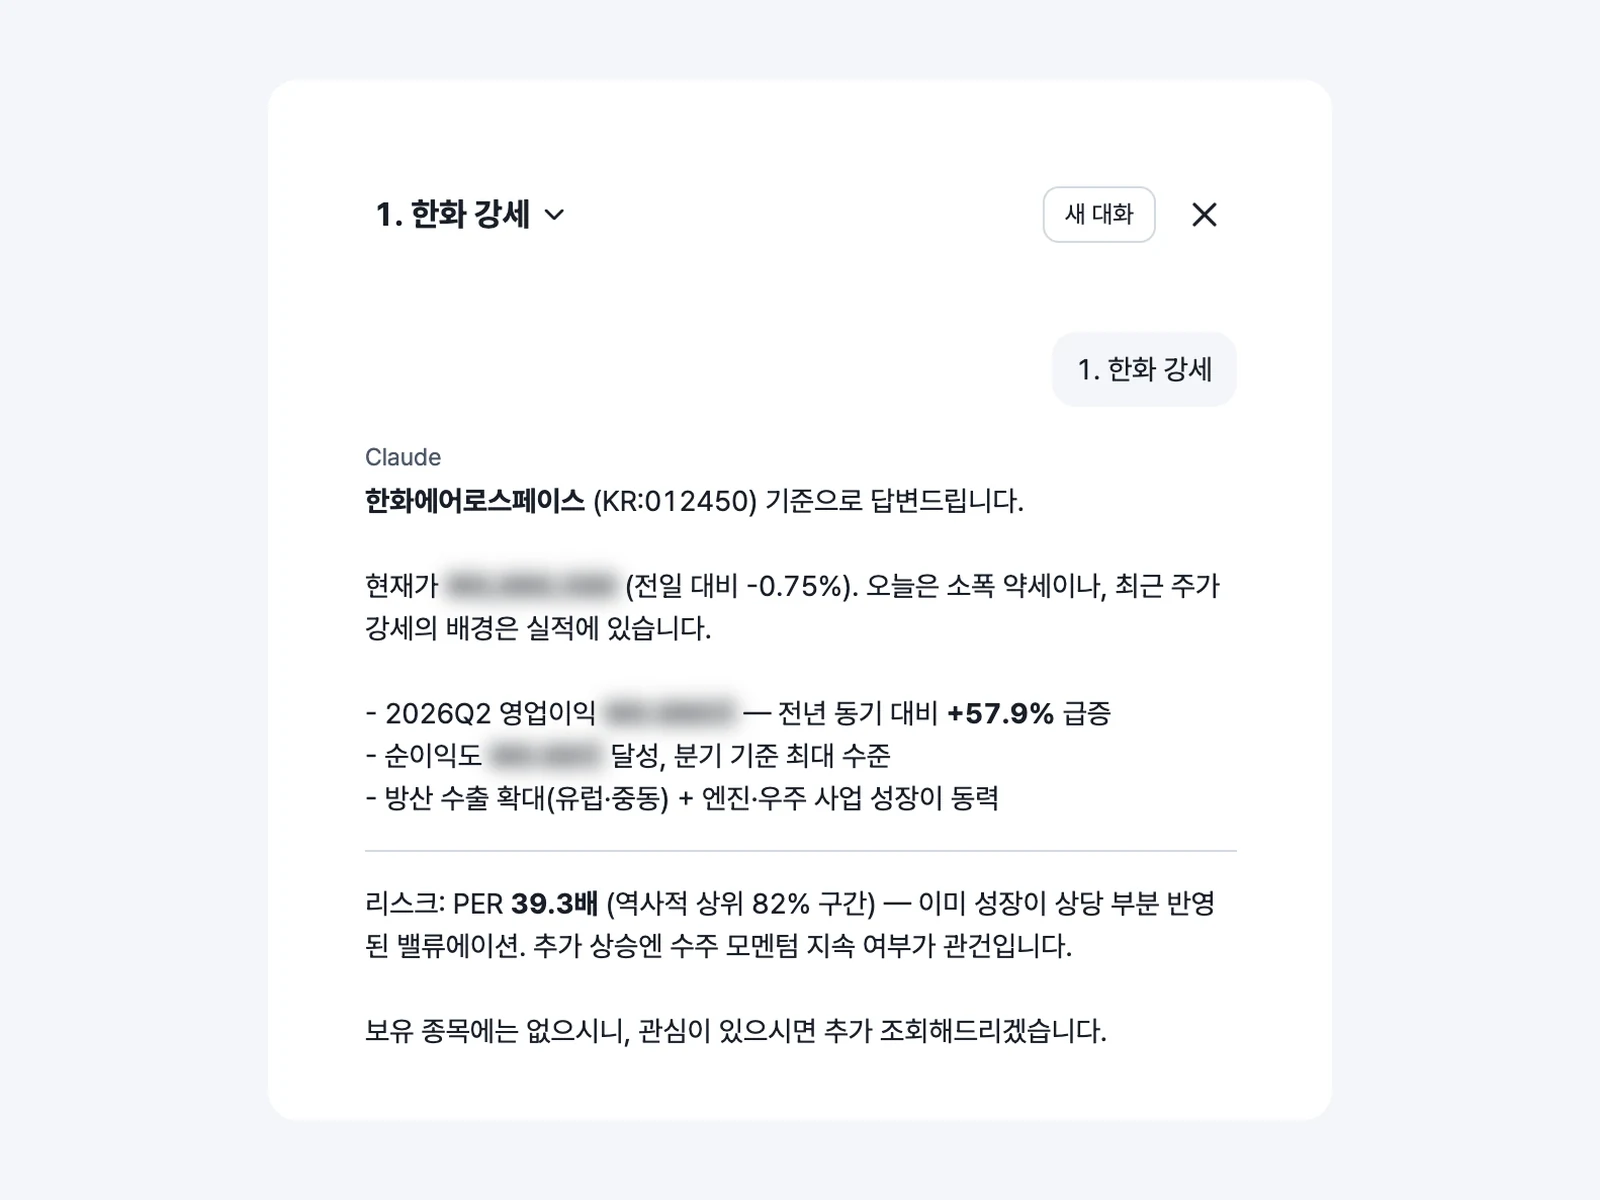
A chat that can only read one account. The assistant answers by calling a small, read-only lookup CLI — holdings, trades, quotes, charts, fundamentals, news, screeners. It runs from an empty working directory, may execute exactly one command family, and its account binding is signed by the server; no command takes an account id, credential-shaped environment variables are stripped from the subprocess, and its session transcripts are wiped nightly.
Dependencies point one way. Market data, research and analysis take a list of symbols and know nothing about who holds them, so one stored analysis serves every account. A test walks the AST of every module and fails if an import goes the wrong way (core ← universe · market · research ← portfolio ← api ← dashboard_web). Three SQLite files in WAL mode each have one owner — the account book, shared market facts, and news — and are backed up nightly with VACUUM INTO behind an integrity check.
Scored afterwards. Stored verdicts are checked against what the price actually did over 5, 10 and 20 trading days, so a prompt change is compared by numbers rather than by how convincing the prose sounds.
Outcome
It runs on a single Oracle Cloud ARM VM behind nginx and Cloudflare, with the app listening on localhost only and nginx accepting traffic from Cloudflare alone. Cron does all the collecting — news, fundamentals, ETF facts, closing snapshots after each market’s close, the screener cache, the symbol master and the evening analysis batch — and the web process only reads. Pages are server-rendered with vanilla JS, hand-drawn SVG charts and Figma-exported tokens, under a strict per-request CSP nonce. No build step.
- 23
- news themes
- 15
- indicators × 3 timeframes
- 3
- SQLite books
- 642
- tests
The thing I keep relearning is that the model is the easy part. What makes a verdict worth reading is everything that happens before the call — a source that raises instead of returning an empty frame, an unfinished weekly bar that is never treated as closed, a missing number that stays missing. The AI is only as honest as the envelope it is handed.